You need to use scale_x_continuous() and scale_y_continuous() with breaks and minor_breaks parameters. Parameter breaks will add major gridlines whereas minor_breaks will add minor gridlines.
Here is an example to show how to add major and minor gridlines to plot:
library(ggplot2)
x <- c(1:10)
y <-sin(x)
df <-data.frame(xvals=x, yvals=y)
p1 <- ggplot(df,aes(x,y)) +
geom_line() +
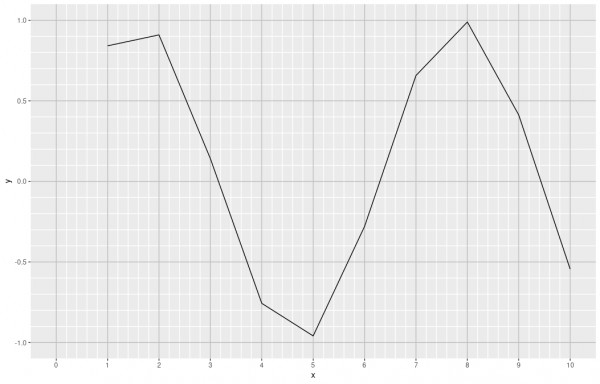
scale_x_continuous(limits = c(0, 10), breaks = seq(0, 10, 1), minor_breaks = seq(0, 10, 0.2)) +
scale_y_continuous(limits = c(-1, 1), breaks = seq(-1, 1, 0.5), minor_breaks = seq(-1, 1, 0.1)) +
theme(panel.grid.major = element_line(colour="grey", size=0.5), panel.grid.minor = element_line(colour="white", size=0.5))
The above code will generate the following plot: