You can use one of the following methods to compute the number of bins for a given data:
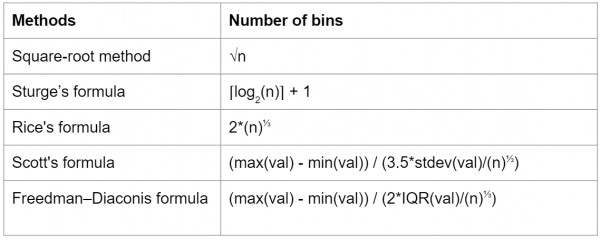
Val: list or vector of values, n: number of elements in the list or vector, IQR: InterQuartile Range, stdev: standard deviation
You can use the following R code to use one of the above methods for bin count:
compute_bin_count <- function(preds, bin_formula){
### compute bin count using one of the approaches
if(bin_formula == "square_root"){
nb <- ceiling(sqrt(length(preds)))
}else if(bin_formula == "sturges"){
nb <- ceiling(log2(length(preds))) + 1
}else if(bin_formula == "rice"){
nb <- ceiling(2*length(preds)^(1/3))
}else if(bin_formula == "scott"){
h <- 3.5 * sd(preds) / length(preds)^(1/3)
nb <- ceiling((max(preds) - min(preds))/h)
}else if(bin_formula == "fd"){
h <- 2 * IQR(preds) / length(preds)^(1/3)
nb <- ceiling((max(preds) - min(preds))/h)
}else{
nb <- 512
}
return(nb)
}
val <- runif(10000)
b_methods <- c("square_root", "sturges", "rice", "scott", "fd")
nbins <- compute_bin_count(val, b_methods[1])
print(nbins)