You can use the histogram() function of Numpy with parameter density=True. When density is True, the function returns the value of the probability density function (PDF) at the bin, normalized such that the integral over the range is 1. The sum of the PDF values will not be equal to 1 unless bins of unity width are chosen.
I am using the histogram() function with 25 bins for the PDF in the following code.
import numpy as np
import matplotlib.pyplot as plt
# random probabilities
n_bins = 25
np.random.seed(7)
probs = np.random.random(500)
# calculate PDF
pdf, bin_edges = np.histogram(probs, bins=n_bins, density=True)
print(pdf)
# plot PDF
plt.plot(bin_edges[1:], pdf)
plt.xlabel("Bins")
plt.ylabel("PDF")
plt.show()
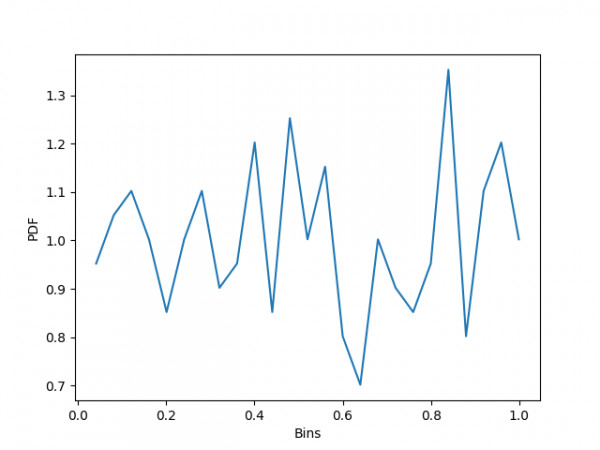
The above code will return the following PDF.
[0.95211234 1.05233469 1.10244586 1.00222351 0.85188999 1.00222351
1.10244586 0.90200116 0.95211234 1.20266821 0.85188999 1.25277939
1.00222351 1.15255704 0.80177881 0.70155646 1.00222351 0.90200116
0.85188999 0.95211234 1.35300174 0.80177881 1.10244586 1.20266821
1.00222351]
It will generate the following PDF plot.