There are several ways to combine plots in R. One of the simplest way is using the grid.arrange() function of gridExtra library. You need to put all ggplots as arguments and specify the number of rows and columns you want in the combined plot.
Here is an example:
library(ggplot2)
library(gridExtra)
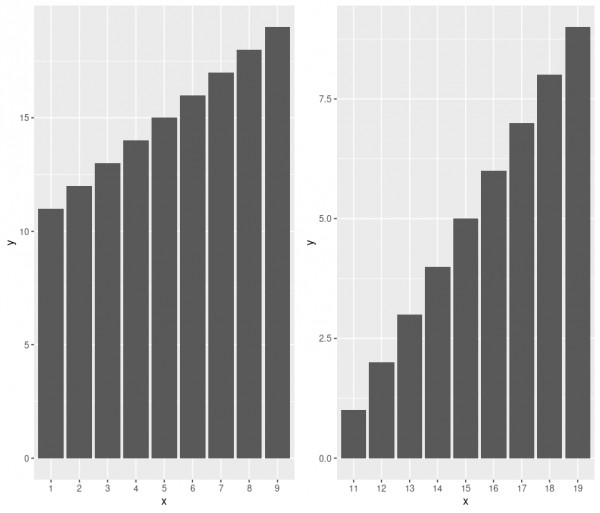
df <- data.frame(x=as.character(c(1:9)), y=c(11:19))
p1 <- ggplot(data = df, aes(x=x, y=y)) +
geom_bar(stat = "identity")
df <- data.frame(x=as.character(c(11:19)), y=c(1:9))
p2 <- ggplot(data = df, aes(x=x, y=y)) +
geom_bar(stat = "identity")
grid.arrange(p1, p2, nrow=1, ncol=2)
I created p1 and p2 and combined them using the grid.arrange() function.
Here is the output: